Lead Reporting
Part of Measuring lead generation quality
Lead volume versus accepted sales enquiries
Compare incoming lead counts with the enquiries sales accepts, using clear denominators and a visible assessment backlog.
Lead volume counts incoming records under a stated rule. Accepted sales enquiries count requests the receiving team has assessed and agreed it can act on. Compare both counts with the assessment backlog: more submissions can conceal fewer usable requests, while pending reviews can temporarily depress the accepted count.
Decide what enters each count
Start with requests received in a defined period. Count a request when it reaches the business, not when someone clicks a button. Decide how repeated submissions about the same need are handled.
Show raw submissions, excluded tests or spam, duplicates and genuine enquiries separately.
Define acceptance as a recorded decision with a specific next action. It is not the same as putting a record in a queue, opening an email or making an unanswered call. A potentially relevant request missing one fact can remain awaiting clarification.
Status / Meaning for this comparison
- Awaiting assessment
- A genuine request has arrived but has no decision
- Needs clarification
- A decision depends on another fact
- Accepted
- Sales agrees to a specific follow-up action
- Not accepted
- An assessed request fails the agreed rule
- Excluded
- Test, spam or duplicate under the documented counting rule
These are suggested statuses. Record a brief reason for each assessment decision so the review can distinguish poor fit from missing detail or limited capacity.
Show volume and acceptance side by side
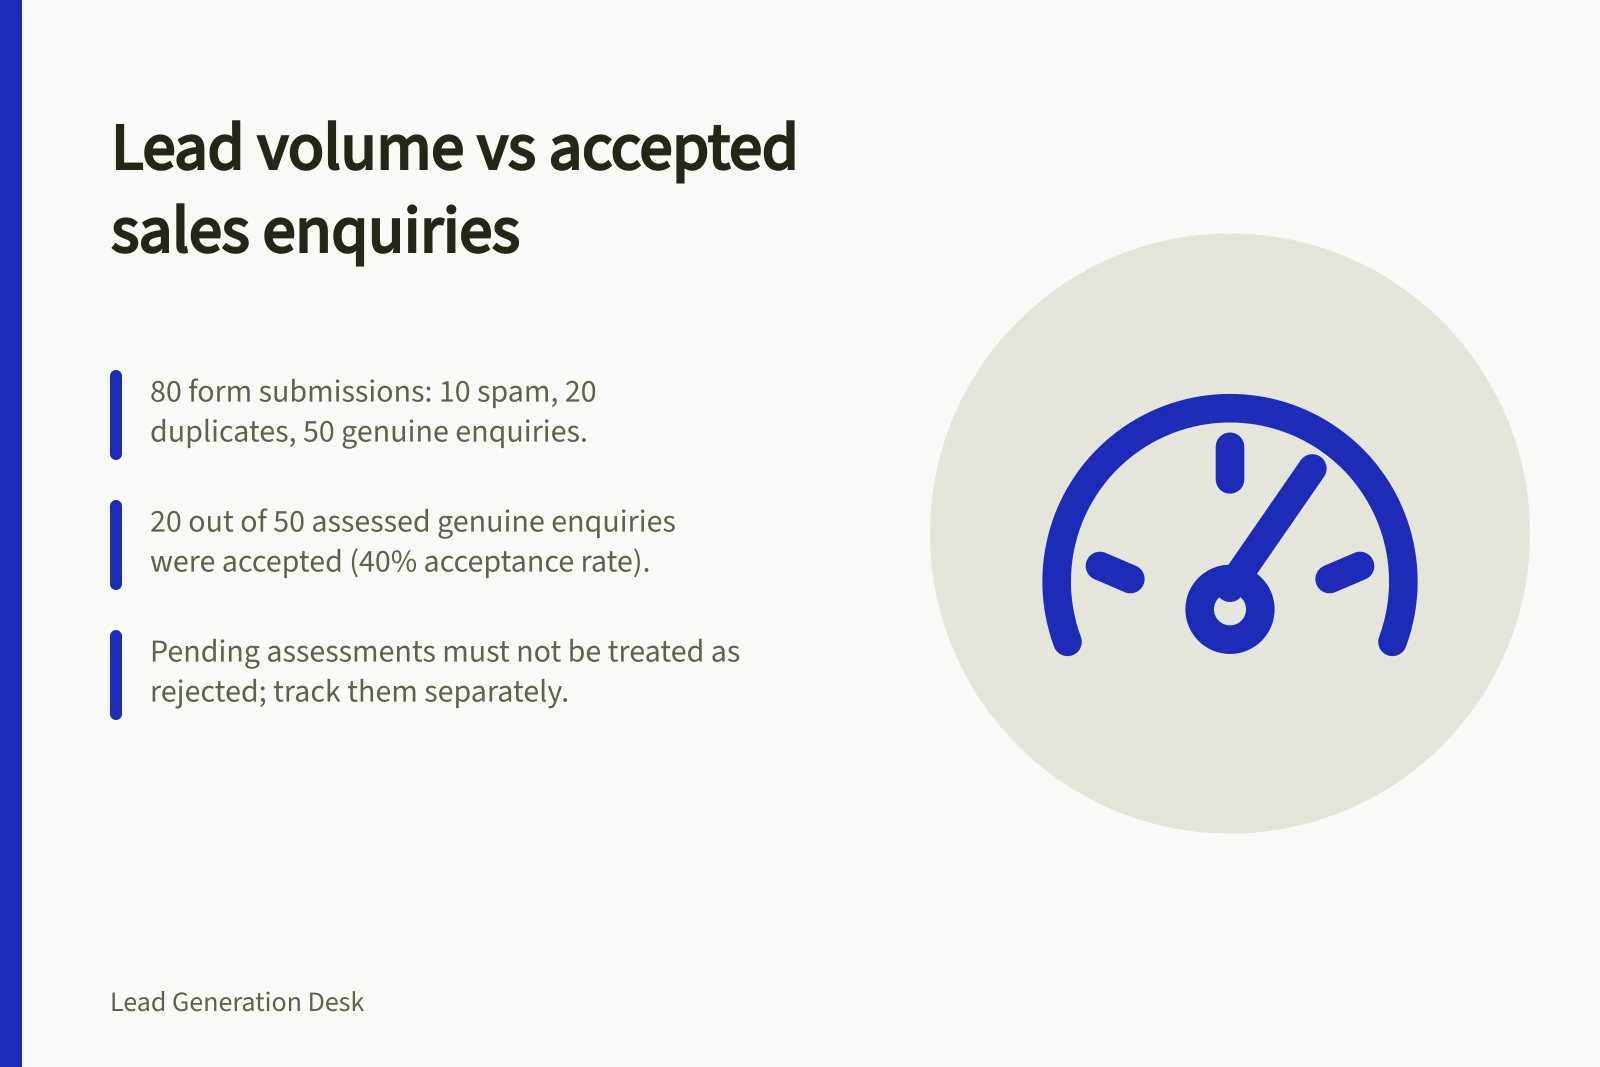
Suppose a hypothetical campaign produces 80 form submissions. Ten are tests or spam and 20 repeat an existing request. That leaves 50 genuine enquiries. If all 50 are assessed and sales accepts 20, report 80 submissions → 50 genuine enquiries → 20 accepted enquiries.
The acceptance rate among assessed genuine enquiries is 20 ÷ 50 = 40%. Dividing by all 80 submissions gives 25%, which answers a different question. Show the numerator and denominator beside any rate.
If 15 genuine enquiries are still awaiting assessment, report them separately and calculate an assessed-only acceptance rate from the cases actually assessed. Do not treat pending cases as rejected.
Compare periods under the same rules and allow similar time for assessment. Date a change to the acceptance rule; otherwise a changed rate may reflect the rule rather than the requests.
Investigate the gap
Read non-accepted requests alongside the offer that produced them. Repeated requests for work the business does not provide may point to a mismatch in the promise or audience. Relevant requests missing one essential detail may call for a clearer first question or reply. Suitable requests left pending point to the assessment process.
Use the comparison to decide which gap to investigate: raw submissions to genuine requests, genuine requests to assessed cases, or assessed cases to accepted enquiries. Each calls for different evidence.